CUDA Streams and Events
Table of Contents
- 1. The CUDA Execution Model
- 2. CUDA Streams
- 3. CUDA Events
- 4. Synchronization Semantics
- 5. PyTorch Integration
- 6. Profiling with CUDA Events and torch.profiler
- 7. Common Patterns and Pitfalls
- References
1. The CUDA Execution Model 🏗️
1.1 The Host-Device Command Model
A CUDA program runs on two distinct processors simultaneously: the host (CPU) and the device (GPU). The host is responsible for submitting work; the device is responsible for executing it. The communication channel between them is an asynchronous command queue.
Definition (CUDA Execution Model). The host submits GPU operations — kernels (computation) and memory copies (data movement) — to a queue. The CUDA runtime delivers commands from the queue to the GPU hardware. From the host’s perspective, kernel launch is near-instantaneous: the runtime enqueues the command and returns control to the host thread without waiting for the GPU to finish.
This asynchrony is fundamental. A naive timing loop like
import time
t0 = time.perf_counter()
y = torch.matmul(A, B)   # enqueues kernel, returns immediately
t1 = time.perf_counter()
print(t1 - t0)           # measures enqueue time, NOT execution time
measures only how long the host takes to submit the kernel, not how long the GPU takes to run it. This error is addressed precisely in Section 3.3.
1.2 GPU Execution Engines ⚙️
Modern NVIDIA GPUs expose multiple independent execution engines. The relevant engines for stream-level concurrency are:
| Engine | CUDA name | Handles |
|---|---|---|
| Compute engine | — | Kernel execution (SM warps) |
| Copy engine H2D | cudaMemcpyHostToDevice |
Host → Device DMA transfers |
| Copy engine D2H | cudaMemcpyDeviceToHost |
Device → Host DMA transfers |
Because these engines are physically distinct, a copy to device memory and a compute kernel can run simultaneously, provided they reside in different streams. The hardware schedules work from multiple streams concurrently when independent engines are available.
flowchart LR
    Host["Host Thread
(CPU)"]
    S0["Stream 0
(default)"]
    S1["Stream 1"]
    CE["Compute
Engine"]
    H2D["DMA Engine
H2D"]
    D2H["DMA Engine
D2H"]

    Host -->|"enqueue"| S0
    Host -->|"enqueue"| S1
    S0 --> CE
    S1 --> H2D
    S1 --> D2H
The host enqueues work into streams; each stream is dispatched to one or more GPU engines. Separate engines can operate concurrently.
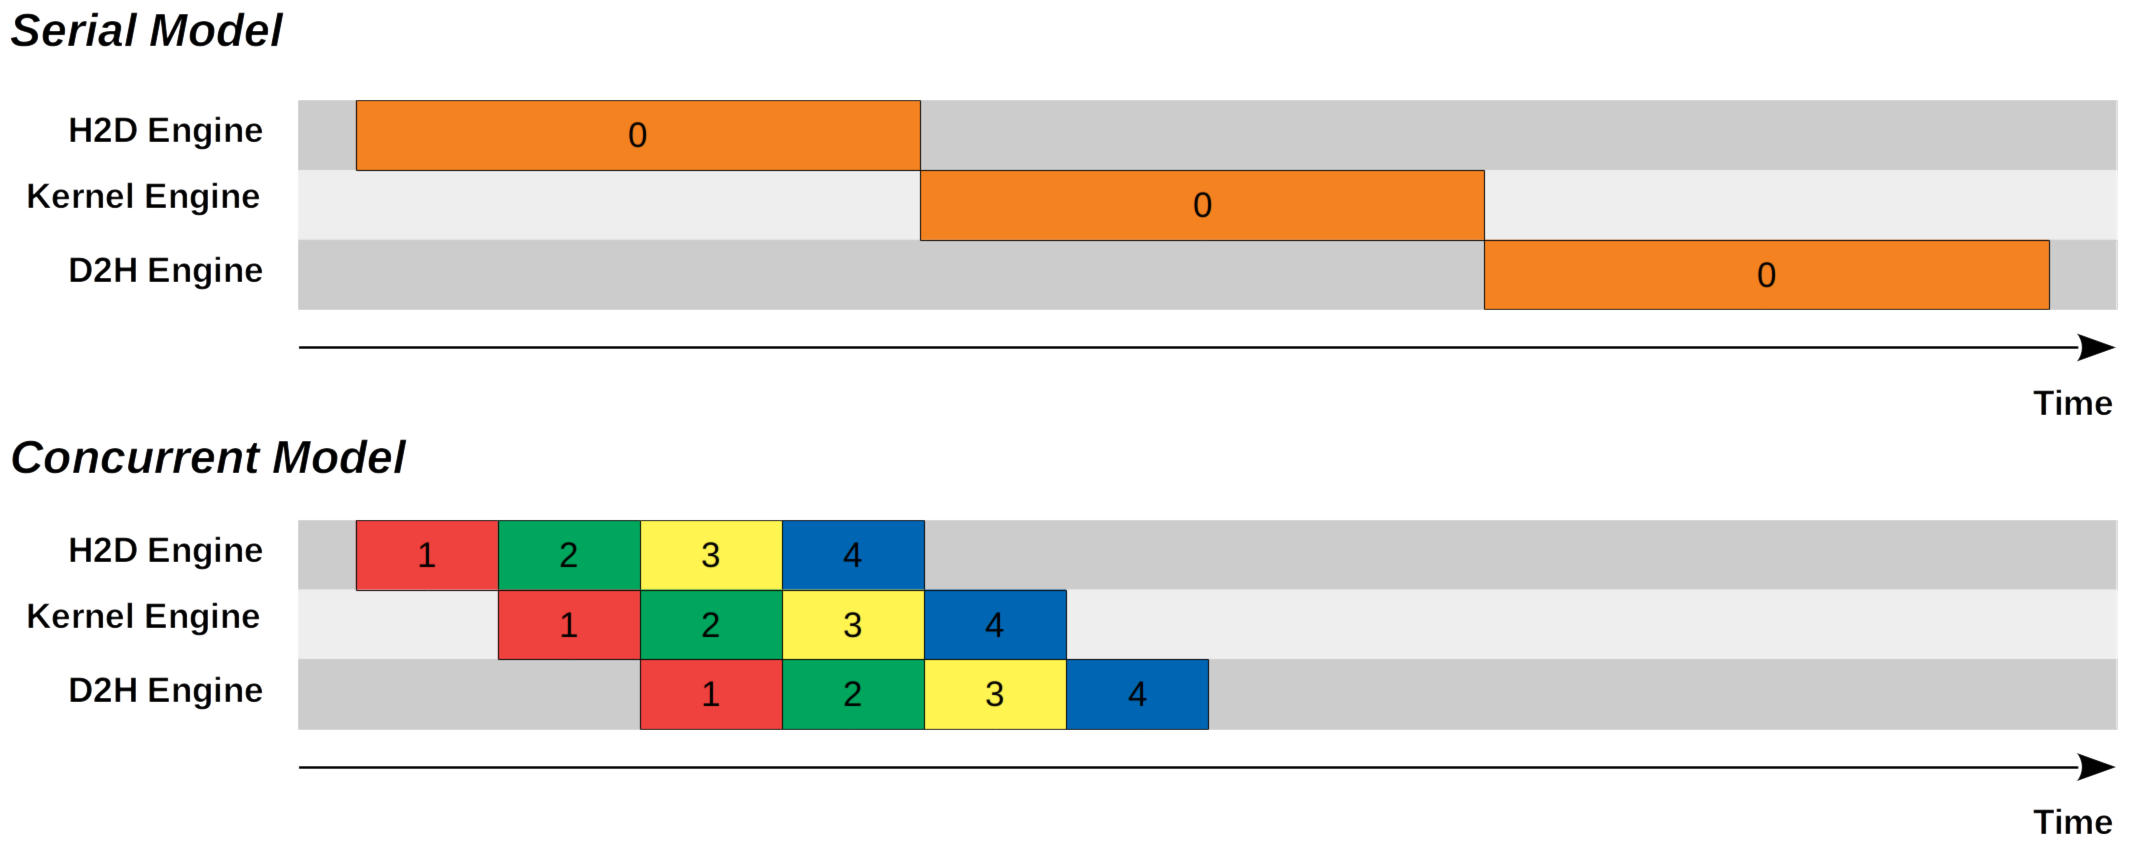
Figure 1 (Lei Mao, 2020): Serial model (top) — a single stream keeps H2D, Kernel, and D2H engines busy one at a time. Concurrent model (bottom) — four streams pipeline across the same three engines, each staggered by one operation, reducing total wall time by ~3×.
2. CUDA Streams 🌊
2.1 Formal Definition
Definition (CUDA Stream). A CUDA stream is a total-order sequence of GPU operations — kernels and memory copies — such that operations within a single stream execute in issue order relative to each other. Operations belonging to different streams have no ordering guarantee and may execute concurrently, subject to hardware resource availability.
More precisely, let \(S\) be a stream and let \(o_1, o_2 \in S\) be two operations with \(o_1\) enqueued before \(o_2\). The GPU guarantees \(o_1\) completes before \(o_2\) begins. For operations \(o \in S_1\) and \(o' \in S_2\) with \(S_1 \neq S_2\), no such guarantee exists unless an explicit synchronization primitive is used (see Section 4).
A stream is a logical ordering constraint on the GPU command queue. It is not a CPU thread and does not impose concurrency at the CPU level. A single host thread can own and submit to arbitrarily many streams.
2.2 The Default Stream and Implicit Synchronization ⚠️
Every CUDA context has a default stream (also called the NULL stream or stream 0). In the legacy default stream mode — the default for most CUDA programs — the default stream has a special serialization property:
Definition (Legacy Default Stream). The legacy default stream synchronizes with all other blocking streams in the same CUDA context. Specifically, when an operation is submitted to the legacy default stream, the runtime inserts an implicit synchronization barrier: all previously enqueued work on blocking streams drains first, then the default-stream operation runs, then blocking streams may resume.
The consequence is global serialization. Suppose you submit kernel \(k_1\) to stream \(S_1\), then \(k_2\) to the default stream, then \(k_3\) to \(S_1\). Even if \(k_1\), \(k_2\), \(k_3\) are all independent, \(k_2\) will wait for \(k_1\), and \(k_3\) will wait for \(k_2\):
sequenceDiagram
    participant S1 as Stream S1
    participant S0 as Default Stream
    S1->>S0: k1 completes (implicit sync)
    Note over S0: k2 runs
    S0->>S1: k3 unblocked (implicit sync)
Implicit serialization introduced by a single default-stream operation.
This makes the default stream a correctness trap in multi-stream programs. Any operation routed to stream 0 acts as a global fence.
2.3 Non-Blocking Streams
PyTorch non-default streams are created with the cudaStreamNonBlocking flag, which exempts them from the legacy default stream synchronization protocol. Such streams interact with the default stream only via explicit synchronization (events or wait_stream), not implicitly.
CUDA also supports a per-thread default stream mode (enabled via the --default-stream per-thread compiler flag, or by using cudaStreamPerThread). In this mode each host thread has its own independent default stream, and none of them implicitly synchronize with each other. PyTorch does not use per-thread default streams by default; be aware of this when interoperating with raw CUDA C extensions.
2.4 PyTorch Stream API 🐍
PyTorch wraps CUDA streams through torch.cuda.Stream.
import torch

# Create a non-default stream on the current device
s1 = torch.cuda.Stream()

# Create a stream on a specific device
s2 = torch.cuda.Stream(device="cuda:1")

# Context manager: all PyTorch ops inside the block go to s1
with torch.cuda.stream(s1):
    y = torch.matmul(A, B)   # enqueued on s1

# Explicit: block host until s1 is fully drained
s1.synchronize()

# GPU-side: make s1 wait for s2 (host does NOT block)
s1.wait_stream(s2)

# Check if all work submitted so far to s1 is done
done: bool = s1.query()
Key methods on torch.cuda.Stream:
| Method | Semantics | Blocks host? |
|---|---|---|
s.synchronize() |
Wait until all ops in s complete |
Yes |
s.wait_stream(other) |
GPU-side: future ops in s wait for other |
No |
s.wait_event(event) |
GPU-side: future ops in s wait for event |
No |
s.record_event(event=None) |
Insert event into s; returns the event |
No |
s.query() |
Returns True if s is idle |
No |
2.5 Key Pattern: Overlapping Compute and Data Transfer 🔑
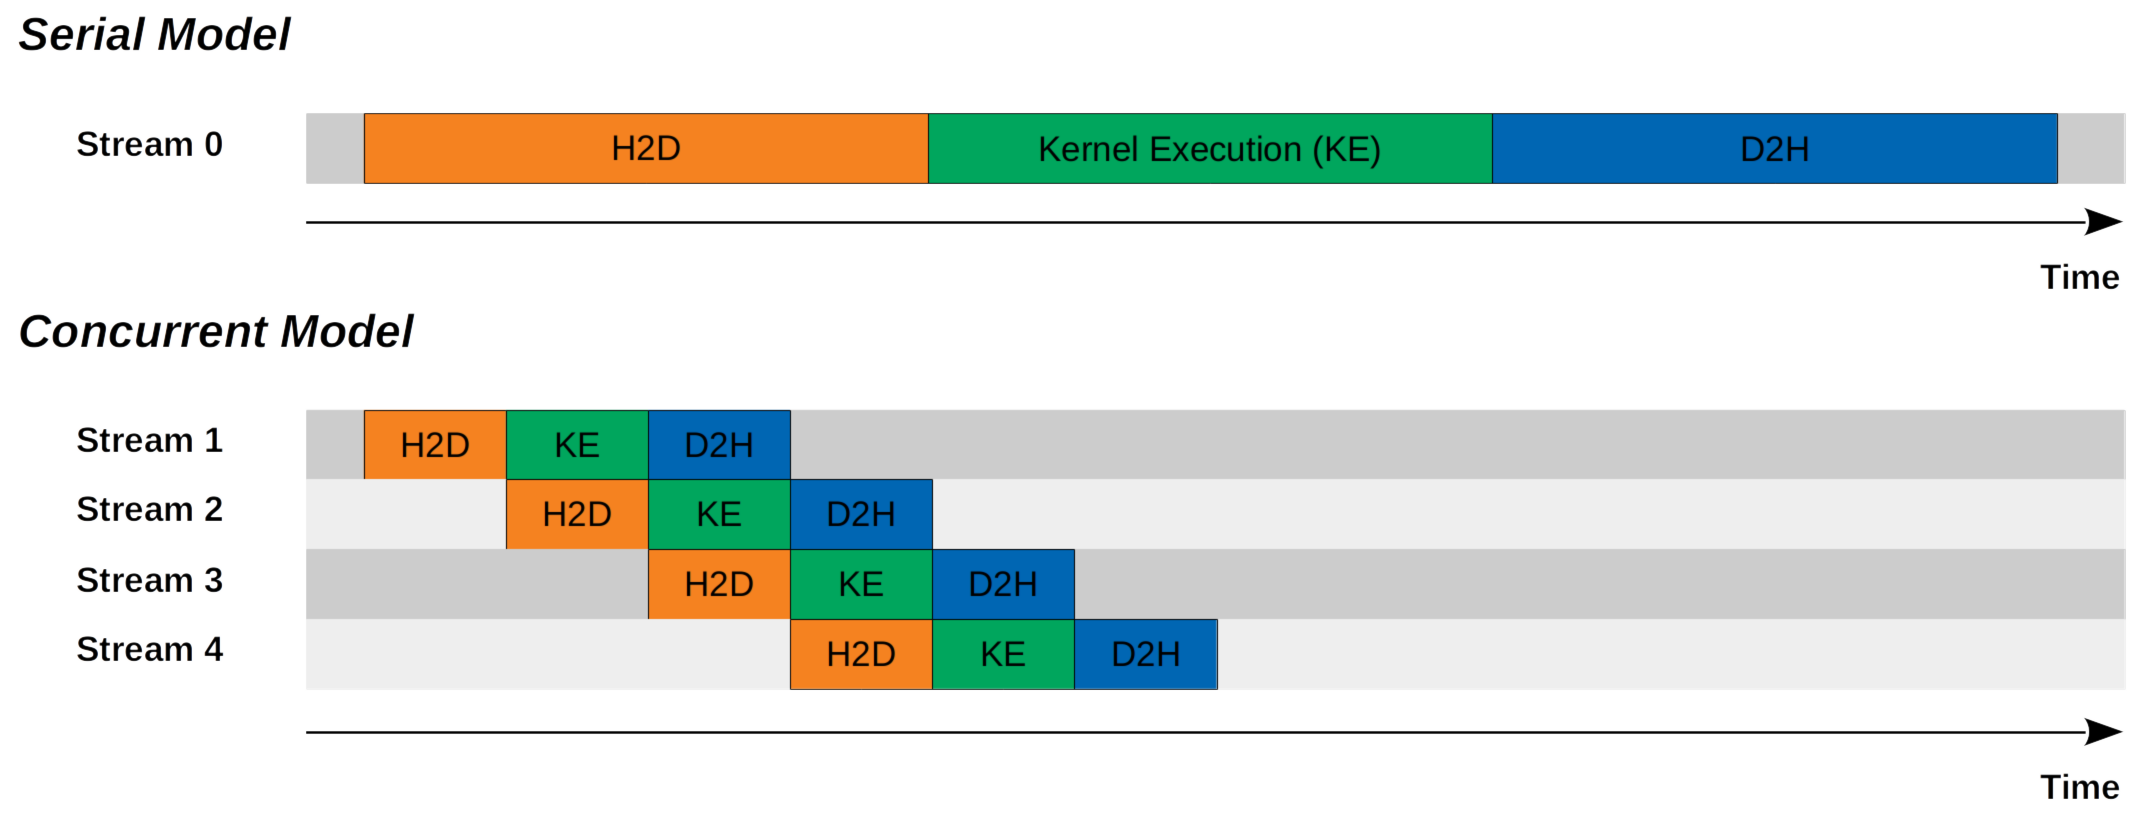
Figure 2 (Lei Mao, 2020): The same overlap shown from the stream perspective. Serial model — Stream 0 sequences H2D → Kernel Execution → D2H end-to-end. Concurrent model — Streams 1–4 each carry the same sequence, but staggered so each stream’s kernel execution overlaps with the next stream’s H2D transfer.
Both the compute engine and the DMA H2D engine can run simultaneously. This means: while the GPU is running a forward pass on batch \(k\) in stream 0, stream 1 can be DMA-ing batch \(k+1\) from host to device. The result is that data transfer latency is fully hidden behind compute.
Requirements for this overlap: 1. Host memory must be page-locked (pinned). The DMA engine can only initiate asynchronous transfers from pinned memory; pageable memory requires an intermediate copy via a staging buffer, which stalls. 2. The transfer and compute must be in different streams.
import torch

device = torch.device("cuda:0")

# Allocate pinned host tensors for double-buffering
host_batch = [
    torch.randn(1024, 512, pin_memory=True) for _ in range(2)
]
# Pre-allocate device buffers
dev_batch = [torch.empty(1024, 512, device=device) for _ in range(2)]

compute_stream = torch.cuda.default_stream(device)
transfer_stream = torch.cuda.Stream(device=device)

batches = get_batch_iterator()  # yields CPU tensors

# Seed: prefetch batch 0
with torch.cuda.stream(transfer_stream):
    dev_batch[0].copy_(host_batch[0], non_blocking=True)
transfer_stream.synchronize()

for step, batch_cpu in enumerate(batches):
    buf_idx = step % 2
    next_idx = 1 - buf_idx

    # --- Enqueue prefetch of next batch (runs on transfer_stream) ---
    with torch.cuda.stream(transfer_stream):
        host_batch[next_idx].copy_(batch_cpu, non_blocking=True)
        dev_batch[next_idx].copy_(host_batch[next_idx], non_blocking=True)

    # --- Compute on current batch (runs on compute_stream = default) ---
    # compute_stream must not start until transfer of current buf is done.
    # transfer_stream must have finished loading buf_idx before we use it.
    compute_stream.wait_stream(transfer_stream)
    output = model(dev_batch[buf_idx])
    loss = criterion(output, targets)
    loss.backward()
    optimizer.step()

    # Tell allocator: dev_batch[buf_idx] is live on compute_stream too
dev_batch[buf_idx].record_stream(compute_stream)non_blocking=True on .copy_()?
tensor.copy_(src, non_blocking=True) issues the H2D (or D2H) transfer asynchronously. For a pinned-memory source, the copy is dispatched to the DMA engine and control returns to the host immediately. Without non_blocking=True, the host blocks until the copy completes, negating any overlap.
This exercise checks whether you have identified all the necessary synchronization points in the double-buffering pattern.
Prerequisites: 2.5 Key Pattern: Overlapping Compute and Data Transfer
Consider the following simplified double-buffering loop. Identify every synchronization bug — places where a race condition or use-after-free can occur — and explain precisely which hardware race each one introduces.
s_transfer = torch.cuda.Stream()
dev = [torch.empty(N, device="cuda") for _ in range(2)]

for step, cpu_batch in enumerate(loader):
    i = step % 2
    j = 1 - i
    with torch.cuda.stream(s_transfer):
        dev[j].copy_(cpu_batch, non_blocking=True)
output = model(dev[i]) # runs on default streamKey insight: There are two independent races: one between the transfer stream finishing the previous load of dev[i] before model() reads it, and one between the allocator potentially reusing dev[i]’s memory before the compute stream finishes.
Sketch:
Bug 1 — Missing compute_stream.wait_stream(s_transfer) before model(dev[i]).
At step step=1, i=1. dev[1] was loaded in step 0 (on s_transfer). Without wait_stream, the default stream may begin model(dev[1]) before s_transfer has finished the copy_ from step 0, since the two streams have no ordering relationship. Fix: torch.cuda.default_stream().wait_stream(s_transfer) before model(dev[i]).
Bug 2 — Missing dev[i].record_stream(compute_stream).
Without record_stream, PyTorch’s caching allocator tracks dev[i] as allocated on s_transfer only. If dev[i] goes out of scope (or is reused) before the allocator is notified that compute_stream is still touching it, the allocator may hand that memory to a new allocation mid-kernel. Fix: call dev[i].record_stream(torch.cuda.current_stream()) after the model() call so the allocator defers reuse until the compute stream is done.
3. CUDA Events ⏱️
3.1 Formal Definition
Definition (CUDA Event). A CUDA event is a synchronization marker that may be recorded into a stream at a specific point in that stream’s execution order. An event has two observable states:
- Not yet recorded: the GPU pipeline has not yet reached the point where the event was enqueued.
- Recorded: the GPU has completed all operations up to and including the event’s position in its stream.
Events serve two distinct purposes: 1. Cross-stream dependency: stream \(S_B\) can be instructed to wait until an event recorded in stream \(S_A\) has fired, establishing a happens-before relationship \(e_{S_A} \prec \text{ops in } S_B\). 2. GPU-side elapsed time: a pair of events \((e_\text{start}, e_\text{end})\) recorded around a sequence of operations yields an elapsed time that reflects actual GPU execution time, not CPU scheduling time.
Formally, if event \(e\) is recorded at position \(p\) in stream \(S\), then \(e\) is recorded if and only if all operations at positions \(\leq p\) in \(S\) have completed on the GPU.
3.2 PyTorch Event API 🐍
import torch

# Create a timing-capable event (enable_timing=True required for elapsed_time)
start = torch.cuda.Event(enable_timing=True)
end   = torch.cuda.Event(enable_timing=True)

# Record start into the current stream
start.record()

# ... GPU work ...
C = torch.matmul(A, B)

# Record end into the current stream
end.record()

# Block host until end event has been recorded on GPU
end.synchronize()

# Returns elapsed time in milliseconds (float)
ms = start.elapsed_time(end)
print(f"matmul took {ms:.3f} ms")
torch.cuda.Event constructor parameters:
| Parameter | Type | Default | Meaning |
|---|---|---|---|
enable_timing |
bool | False |
Must be True to use elapsed_time() |
blocking |
bool | False |
If True, wait() blocks the CPU thread |
interprocess |
bool | False |
Enables cross-process sharing via IPC handle |
Key methods:
| Method | Semantics | Blocks host? |
|---|---|---|
e.record(stream=None) |
Insert marker at current position in stream |
No |
e.wait(stream=None) |
GPU-side: stream will not proceed past this until e is recorded |
No |
e.synchronize() |
Block host until e has been recorded |
Yes |
e.elapsed_time(end_event) |
Milliseconds between self and end_event |
Must call end_event.synchronize() first |
e.query() |
True if event has been recorded |
No |
elapsed_time before synchronize
Calling start.elapsed_time(end) before end.synchronize() will raise a RuntimeError or return garbage if the GPU has not yet reached end. Always call end.synchronize() first.
3.3 The GPU Timing Trap ⚠️
This is one of the most common correctness errors in ML performance work.
The trap. Kernel launches are asynchronous. When you write:
import time

torch.cuda.synchronize()          # drain queue first for a fair start
t0 = time.perf_counter()
C = torch.matmul(A, B)            # enqueues kernel, returns ~immediately
t1 = time.perf_counter()
print((t1 - t0) * 1e3, "ms")     # WRONG: measures ~microseconds of launch overhead
time.perf_counter() captures wall-clock time on the CPU. Because matmul launches asynchronously, t1 - t0 is the time to submit the kernel to the queue — typically 10–100 µs regardless of the matrix size — not the time to execute it (which may be tens of milliseconds for large matrices).
Variant with synchronize but still wrong. A common (incorrect) fix:
t0 = time.perf_counter()
C = torch.matmul(A, B)
torch.cuda.synchronize()          # correct barrier...
t1 = time.perf_counter()          # ...but t0 was captured before synchronize
This measures enqueue time + synchronization time, which includes scheduling jitter and is noisy across runs.
Correct pattern using events:
start = torch.cuda.Event(enable_timing=True)
end   = torch.cuda.Event(enable_timing=True)

start.record()
C = torch.matmul(A, B)
end.record()

end.synchronize()                  # block host until GPU reaches end
ms = start.elapsed_time(end)       # pure GPU execution time
print(f"{ms:.3f} ms")
The event timer lives entirely on the GPU clock. It is immune to CPU scheduling jitter and does not require any perf_counter call.
This exercise connects the roofline model to event-based timing, making the boundary between compute-bound and memory-bound concrete.
Prerequisites: 3.3 The GPU Timing Trap, Roofline Model, Arithmetic Intensity
Let \(A \in \mathbb{R}^{M \times K}\) and \(B \in \mathbb{R}^{K \times N}\) be FP16 matrices. You run a single torch.matmul(A, B) on an A100 80 GB SXM (FP16 peak: 312 TFLOPS, HBM bandwidth: 2 TB/s).
Compute the theoretical minimum runtime for the GEMM, taking into account both the compute bound (\(T_\text{compute}\)) and the memory-bandwidth bound (\(T_\text{memory}\)). State which regime dominates as a function of \(M, K, N\).
For \(M = K = N = 4096\), compute the predicted runtime and compare it to the event-measured value. Write the complete benchmarking code using
torch.cuda.Event.If your measured time is 3× larger than the theoretical minimum, name two plausible hardware or software reasons.
Key insight: The GEMM is compute-bound when arithmetic intensity \(I > I^*\) (the ridge point), and memory-bound otherwise. The ridge point for the A100 is \(I^* = 312 \times 10^{12} / (2 \times 10^{12}) = 156\) FLOP/byte.
Sketch:
(a) Theoretical bounds.
A standard GEMM \(C = AB\) requires \(F = 2MKN\) FLOPs. In FP16, matrices \(A\) (size \(MK\)), \(B\) (size \(KN\)), and \(C\) (size \(MN\)) each occupy 2 bytes per element. Total bytes transferred: \(B = 2(MK + KN + MN)\) bytes.
Arithmetic intensity: \(I = F / B = 2MKN / [2(MK + KN + MN)]\).
For large square matrices with \(M = K = N = d\): \(I \approx d/3\).
- \(T_\text{compute} = F / \Pi = 2d^3 / (312 \times 10^{12})\) seconds
- \(T_\text{memory} = B / \beta = 6d^2 \times 2 / (2 \times 10^{12})\) seconds
- Dominant: whichever is larger. For \(d \gg 3I^* = 468\), compute dominates.
(b) For \(d = 4096\): \(F = 2 \times 4096^3 \approx 1.374 \times 10^{11}\) FLOPs, so \(T_\text{compute} \approx 0.44\) ms; \(B = 6 \times 4096^2 \times 2 \approx 2.01 \times 10^8\) bytes, so \(T_\text{memory} \approx 0.10\) ms. The GEMM is compute-bound; predicted time \(\approx 0.44\) ms.
import torch

M = K = N = 4096
A = torch.randn(M, K, dtype=torch.float16, device="cuda")
B = torch.randn(K, N, dtype=torch.float16, device="cuda")

# Warmup
for _ in range(5):
    torch.matmul(A, B)
torch.cuda.synchronize()

start = torch.cuda.Event(enable_timing=True)
end   = torch.cuda.Event(enable_timing=True)
start.record()
C = torch.matmul(A, B)
end.record()
end.synchronize()
print(f"Measured: {start.elapsed_time(end):.3f} ms  |  Predicted: ~0.44 ms")
(c) Reasons for 3× gap: 1. Occupancy limits / register pressure: if the GEMM kernel cannot fill all SMs to full occupancy, peak TFLOPS is not realized. 2. Memory bank conflicts or non-coalesced access in shared memory tiling: the cuBLAS kernel may not achieve ideal shared memory throughput on every tile configuration.
4. Synchronization Semantics 🔒
4.1 Taxonomy of Synchronization Primitives
There are four distinct synchronization operations in the PyTorch/CUDA stack. They differ on two axes: who blocks (host CPU vs GPU pipeline) and scope (all streams vs one stream vs one event).
| Primitive | Who blocks | Scope |
|---|---|---|
torch.cuda.synchronize() |
Host | All streams, current device |
stream.synchronize() |
Host | One stream |
event.synchronize() |
Host | One event (i.e., all ops up to event in its stream) |
stream.wait_event(event) / event.wait(stream) |
GPU pipeline only | One event → one stream dependency |
stream.wait_stream(other) |
GPU pipeline only | All ops in other at call time → stream |
Definition (CPU-blocking synchronization). A synchronization call is CPU-blocking if the host thread is suspended (via an OS wait or spin-loop) until the specified GPU condition is satisfied. During this time, the host cannot issue new work.
Definition (GPU-only synchronization). A synchronization call is GPU-only if it inserts a dependency barrier into the GPU command queue without suspending the host. The host continues executing immediately; only the GPU pipeline stalls at the barrier point.
4.2 CPU-Blocking vs GPU-Only Synchronization
sequenceDiagram
    participant CPU as Host CPU
    participant S1 as Stream 1 (GPU)
    participant S2 as Stream 2 (GPU)

    Note over CPU: GPU-only: stream.wait_event(e)
    CPU->>S1: record event e
    CPU->>S2: wait_event(e)  [returns immediately]
    CPU->>CPU: continues work
    S1-->>S2: e fires (GPU internal)
    Note over S2: S2 unblocked

    Note over CPU: CPU-blocking: event.synchronize()
    CPU->>S1: record event e
    CPU->>CPU: event.synchronize()
    S1-->>CPU: e fires (wakes host)
    Note over CPU: host resumes
Top half: GPU-only dependency — host continues immediately. Bottom half: CPU-blocking — host sleeps until the GPU reaches the event.
💡 Prefer GPU-only synchronization inside training loops. CPU-blocking calls serialize the host against the GPU, introducing idle time on both sides.
Inserting torch.cuda.synchronize() inside the per-step training loop eliminates all stream-level parallelism. Every call drains the entire GPU pipeline before the host can submit the next batch of work, turning asynchronous pipelining into a strictly sequential execution. Reserve synchronize() for debugging and benchmarking.
This exercise tests whether you can distinguish CPU-blocking from GPU-only synchronization and identify incorrect timing patterns.
Prerequisites: 4.1 Taxonomy of Synchronization Primitives, 3.3 The GPU Timing Trap
For each of the following three code snippets, state: (i) whether the timing result is correct; (ii) what the measured quantity actually is; (iii) how to fix it if it is wrong.
Snippet A:
t0 = time.perf_counter()
out = model(x)
torch.cuda.synchronize()
t1 = time.perf_counter()
Snippet B:
start = torch.cuda.Event(enable_timing=True)
end   = torch.cuda.Event(enable_timing=True)
start.record()
out = model(x)
end.record()
ms = start.elapsed_time(end)  # called immediately
Snippet C:
s = torch.cuda.Stream()
start = torch.cuda.Event(enable_timing=True)
end   = torch.cuda.Event(enable_timing=True)
with torch.cuda.stream(s):
    start.record()
    out = model(x)
    end.record()
end.synchronize()
ms = start.elapsed_time(end)Key insight: elapsed_time without synchronize reads an unrecorded event; perf_counter with synchronize is correct but noisier than events; events in a dedicated stream are the cleanest approach.
Sketch:
Snippet A — Conditionally correct. The synchronize() is placed after model(x) and before t1, so t1 - t0 measures: (enqueue time for all ops in model) + (time for GPU to drain up to synchronize). This captures true GPU execution time but includes CPU-side kernel launch overhead in t0. For large models the launch overhead is negligible compared to execution time, so this is acceptable for rough measurements. For tight kernels (< 1 ms), use events. No fix required for correctness, but events are preferred for precision.
Snippet B — Incorrect. start.elapsed_time(end) is called immediately after end.record() without end.synchronize(). At this point the GPU has not necessarily reached end in the queue. The call either raises a RuntimeError or returns an invalid time. Fix: insert end.synchronize() before start.elapsed_time(end).
Snippet C — Correct. All ops are enqueued on stream s, events bracket them in the same stream, and end.synchronize() blocks until the GPU reaches end. elapsed_time then returns accurate GPU execution time.
5. PyTorch Integration 🔧
5.1 Current Stream and Context Manager
PyTorch maintains a per-device current stream. Every PyTorch CUDA operation — torch.matmul, F.layer_norm, optimizer steps, etc. — is enqueued onto the current stream of its device.
import torch

# Query the current stream for device 0
s = torch.cuda.current_stream(device="cuda:0")

# Explicitly set the current stream (persistent, not a context manager)
torch.cuda.set_stream(s1)

# Context manager: temporarily override the current stream
with torch.cuda.stream(s1):
    y = model(x)   # goes to s1
# After the block, current stream reverts to what it was before
torch.cuda.stream(s) is the preferred idiom for multi-stream code because it restores the previous stream on exit, making it composable.
5.2 record_stream and Memory Safety 🔑
The problem. PyTorch’s caching allocator tracks each tensor’s home stream — the stream on which it was allocated. When the tensor’s reference count drops to zero, the allocator marks the memory as free for reuse on the home stream. If another stream is still using that memory (because you passed a tensor across streams without telling the allocator), the allocator may hand the same bytes to a new allocation while the old kernel is still reading or writing them — a silent memory corruption.
Definition (record_stream). tensor.record_stream(stream) registers stream as an additional user of tensor’s underlying storage. The caching allocator will not reuse the storage until both the home stream and all registered streams have advanced past the point where the tensor was last used.
s_transfer = torch.cuda.Stream()
s_compute  = torch.cuda.current_stream()

# Tensor allocated and filled on s_transfer
with torch.cuda.stream(s_transfer):
    buf = torch.empty(1024, device="cuda")
    buf.copy_(cpu_data, non_blocking=True)

# buf is passed to s_compute for kernel use
s_compute.wait_stream(s_transfer)
output = model(buf)

# CRITICAL: tell allocator that buf is in use on s_compute
buf.record_stream(s_compute)
# Now buf can safely go out of scope — the allocator will not
# reuse its memory until s_compute has finished with it.
Without record_stream, dropping buf while s_compute is still running the kernel is a use-after-free.
5.3 The CUDA Caching Allocator and Stream Ordering
PyTorch’s CUDA caching allocator is stream-ordered: allocations are associated with the stream that requested them, and the allocator exploits stream ordering to aggressively reuse memory within a stream without GPU-side synchronization.
Concretely, if tensors \(T_1\) and \(T_2\) are both allocated on stream \(S\), and \(T_1\) is freed before \(T_2\) is allocated (in stream order), the allocator can safely give \(T_2\) \(T_1\)’s memory block, because the GPU will process the free and the allocate in the same order.
When free happens from the wrong stream. If \(T_1\) was allocated on \(S_1\) but freed on \(S_2\) (i.e., the last reference on \(S_2\) drops), the allocator cannot guarantee that \(S_1\) is done with the memory. It therefore: 1. Records a CUDA event on \(S_2\) at the point of free. 2. Defers returning \(T_1\)’s block to the pool until that event fires. 3. Even then, the block is returned to \(S_1\)’s pool, not \(S_2\)’s.
This delayed-free path adds latency and increases pool fragmentation. Allocating and freeing on the same stream is always preferable.
5.4 Multi-GPU Considerations
Each device has its own set of streams and its own default stream. Streams on one device cannot synchronize directly with streams on another device; you must use inter-device events.
with torch.cuda.device(0):
    s0 = torch.cuda.Stream()
    e  = torch.cuda.Event()

with torch.cuda.device(1):
    s1 = torch.cuda.Stream()

# On device 0: do work, record event
with torch.cuda.stream(s0):
    out = layer0(x)
    e.record(s0)         # event recorded on device 0's stream

# On device 1: wait for device 0's event before proceeding
with torch.cuda.stream(s1):
    s1.wait_event(e)     # s1 will not proceed until e fires
out2 = layer1(out.to("cuda:1"))torch.cuda.device(i) sets the current device for the duration of the block. New streams created inside the block belong to device i. This is distinct from stream context managers — device context and stream context are orthogonal.
5.5 Backward Pass Stream Behavior 🔑
Each backward CUDA operation executes on the same stream as its corresponding forward operation. This is not incidental — it means that if you ran independent forward passes on separate streams, their backward passes will also run on those streams concurrently, giving you parallel backward computation for free.
s1 = torch.cuda.Stream()
s2 = torch.cuda.Stream()

with torch.cuda.stream(s1):
    loss1 = model_branch1(x1).sum()

with torch.cuda.stream(s2):
    loss2 = model_branch2(x2).sum()

# backward on s1 and backward on s2 may run concurrently
with torch.cuda.stream(s1):
    loss1.backward()

with torch.cuda.stream(s2):
loss2.backward()Prior to PyTorch 1.9, calling loss.backward() on a non-default stream would automatically synchronize with the default stream, so gradient tensors were safe to use on the default stream immediately after. This implicit sync was removed in 1.9. If you call loss.backward() inside a torch.cuda.stream(s) block, you must explicitly wait for that stream before using the gradients:
with torch.cuda.stream(s):
    loss.backward()

# Required since PyTorch 1.9 — without this, accessing .grad on the
# default stream races with the backward kernel still running on s
torch.cuda.current_stream().wait_stream(s)

optimizer.step()   # now safe: gradients are fully computed
Omitting wait_stream produces a silent race condition — no error is raised, but optimizer steps may read partially-written gradient tensors.
6. Profiling with CUDA Events and torch.profiler 📊
6.1 GPU-Accurate Benchmarking with Events 🔑
Canonical benchmark function. The following pattern correctly measures GPU time while accounting for: - Warmup to fill CUDA JIT caches and page-in GPU memory - Statistical aggregation (mean ± std over multiple iterations) - Pure GPU timing via events (no CPU jitter)
import torch
import statistics

def benchmark(
    fn,
    n_warmup: int = 5,
    n_iters: int = 50,
    device: str = "cuda",
) -> tuple[float, float]:
    """
    Benchmark a GPU function using CUDA events.

    Returns:
        (mean_ms, std_ms): mean and standard deviation of GPU execution
        time in milliseconds over n_iters iterations.
    """
    # 1. Warmup: populate CUDA JIT cache, warm up GPU clocks
    for _ in range(n_warmup):
        fn()
    torch.cuda.synchronize()

    # 2. Create timing events
    timings: list[float] = []
    start = torch.cuda.Event(enable_timing=True)
    end   = torch.cuda.Event(enable_timing=True)

    for _ in range(n_iters):
        start.record()
        fn()
        end.record()
        # Block until this iteration's end event fires
        end.synchronize()
        timings.append(start.elapsed_time(end))

    mean_ms = statistics.mean(timings)
    std_ms  = statistics.stdev(timings) if len(timings) > 1 else 0.0
    return mean_ms, std_ms


# Example usage
A = torch.randn(4096, 4096, dtype=torch.float16, device="cuda")
B = torch.randn(4096, 4096, dtype=torch.float16, device="cuda")
mean, std = benchmark(lambda: torch.matmul(A, B))
print(f"matmul: {mean:.3f} ± {std:.3f} ms")Calling end.synchronize() inside the loop ensures each timing measurement is for exactly one iteration, not an accumulated batch. Without it, the event queue grows and you get a single elapsed time that covers all iterations bundled together, making per-iteration variance invisible.
6.2 torch.profiler 🔍
torch.profiler.profile is a context manager that collects detailed execution traces, attributing CPU time and GPU kernel time to named PyTorch operations.
import torch
from torch.profiler import profile, ProfilerActivity, record_function

model = MyModel().cuda()
x     = torch.randn(32, 512, device="cuda")

with profile(
    activities=[ProfilerActivity.CPU, ProfilerActivity.CUDA],
    record_shapes=True,
    profile_memory=True,
    with_stack=False,
) as prof:
    with record_function("forward_pass"):
        out = model(x)
    with record_function("backward_pass"):
        out.sum().backward()

# Print top operators by total CUDA time
print(
    prof.key_averages().table(
        sort_by="cuda_time_total",
        row_limit=15,
    )
)
The record_function context manager annotates a code region with a user-defined name. That name then appears as a named span in the trace output, making it straightforward to attribute GPU time to logical operations (e.g., "attention_forward", "mlp_backward").
key_averages() columns of interest:
| Column | Meaning |
|---|---|
Self CPU time |
Time in this operator, excluding children |
CPU total |
Cumulative CPU time including all nested ops |
Self CUDA time |
GPU kernel time attributed to this operator alone |
CUDA total |
Cumulative GPU time including children |
# Calls |
Number of invocations |
Input shapes |
Shapes of input tensors (if record_shapes=True) |
Always sort by cuda_time_total or self_cuda_time_total when diagnosing GPU-bound bottlenecks. CPU time is often dominated by Python overhead and launch latency, which can be misleading.
6.3 Chrome Trace Export and Interpretation
prof.export_chrome_trace("trace.json")Open trace.json in chrome://tracing (or ui.perfetto.dev) to see a timeline view.
The trace is structured as a 2D timeline: - Horizontal axis: real wall-clock time. - Vertical lanes (rows): one lane per CPU thread, plus one lane per CUDA stream per device.
What to look for: - GPU kernel bars appear in the CUDA stream lanes. Their width shows actual GPU execution duration. - Gaps between kernel bars in a stream lane indicate idle GPU time — potential overlap opportunity. - Parallel bars across two stream lanes indicate genuine concurrent execution. - CPU operator spans (top lanes) should align left-to-right with the corresponding GPU kernel bars below. If a CPU span is much wider than its kernel bar, launch overhead or Python overhead dominates.
The relationship between streams and trace lanes: each stream is a separate lane. If you have a compute stream and a transfer stream both active, they appear as two parallel rows in the GPU section, and overlapping bars confirm that hardware overlap is actually occurring (not just hoped for).
6.4 Nsight Systems for Low-Level Profiling
For cases where torch.profiler is insufficient — e.g., you need to inspect individual CUDA kernel configurations, warp occupancy, or memory access patterns — use NVIDIA Nsight Systems:
nsys profile \
    --trace=cuda,nvtx,osrt \
    --output=my_trace \
    python train.py
Open the resulting .nsys-rep file in the Nsight Systems GUI. It provides the same stream-level timeline as Chrome trace but with higher fidelity: exact kernel names (e.g., volta_h884gemm_...), launch parameters (grid/block dimensions), and memory transfer events on the DMA engine lanes.
Use nsys when torch.profiler shows a bottleneck but the kernel-level detail is needed to understand why.
This exercise develops the skill of reading a Chrome trace to determine whether stream overlap is actually occurring.
Prerequisites: 6.3 Chrome Trace Export and Interpretation, 2.5 Key Pattern: Overlapping Compute and Data Transfer
You profile a training loop that uses a compute stream and a prefetch stream. The exported Chrome trace shows: the compute stream lane has kernel bars with no gaps, and the prefetch stream lane also has bars — but the prefetch bars are sequential with the compute bars (they start only after the compute bar ends each step), never overlapping.
Name two code-level reasons this could happen despite the code appearing to use two streams.
How would the trace look differently if
non_blocking=Truewere omitted from thecopy_calls?What single line of Python would you add (or remove) to diagnose whether the default stream is causing serialization?
Key insight: Sequential bars despite two streams almost always means either (1) an accidental default-stream operation between them, or (2) the pageable-memory staging-copy blocking the host before the async copy can even begin.
Sketch:
(a) Two causes of unintended serialization:
1. A PyTorch operation in the loop body runs on the default stream. If any op — a loss computation, a .item() call, a tensor print — touches the legacy default stream, that stream acts as a global fence, forcing the prefetch stream to wait. Check: wrap every op in torch.cuda.stream(...) and avoid bare ops outside stream contexts.
2. The source tensor is not pinned. Unpinned host memory cannot be transferred by the DMA engine asynchronously. The CUDA runtime silently falls back to a synchronous copy through a pinned staging buffer, blocking until it completes. This makes the “async” copy synchronous from the GPU’s perspective. Check: assert cpu_tensor.is_pinned().
(b) Without non_blocking=True: the copy_ call on the prefetch stream would block the host thread until the H2D copy completes. The host therefore cannot proceed to enqueue the compute-stream kernel until the copy finishes. The trace would show: prefetch copy runs, then compute kernel runs, strictly sequential — identical appearance to the bug above, but for a different reason.
(c) Diagnosis line: temporarily replace torch.cuda.Stream() with the legacy default stream:
s_transfer = torch.cuda.default_stream() # force all ops onto default streamIf the behavior does not change (still sequential), the issue is not stream assignment — it is the non-pinned memory or a blocking copy. If the behavior does change (now everything is obviously sequential because it’s all on one stream), you have confirmed the issue is a stray default-stream op.
7. Common Patterns and Pitfalls 🗺️
7.1 Double-Buffering for Data Loading Overlap
The canonical pattern for hiding data-loading latency in a training loop:
import torch
from torch.utils.data import DataLoader

def train_with_double_buffer(
    model: torch.nn.Module,
    loader: DataLoader,
    optimizer: torch.optim.Optimizer,
) -> None:
    device = torch.device("cuda:0")
    compute_stream  = torch.cuda.default_stream(device)
    transfer_stream = torch.cuda.Stream(device=device)

    # Pre-allocate two pinned-memory staging buffers
    # (In practice, use pin_memory=True in DataLoader)

    prefetched: torch.Tensor | None = None

    def prefetch(batch_cpu: torch.Tensor) -> None:
        nonlocal prefetched
        with torch.cuda.stream(transfer_stream):
            prefetched = batch_cpu.to(device, non_blocking=True)

    loader_iter = iter(loader)

    # Prime the pump: prefetch first batch
    first_batch = next(loader_iter)
    prefetch(first_batch)

    for batch_cpu in loader_iter:
        # Wait for the previously prefetched batch to arrive
        compute_stream.wait_stream(transfer_stream)
        batch_gpu = prefetched

        # Mark tensor as used on compute stream so allocator is safe
        assert batch_gpu is not None
        batch_gpu.record_stream(compute_stream)

        # Concurrently prefetch the next batch
        prefetch(batch_cpu)

        # --- Forward / backward / optimizer step ---
        logits = model(batch_gpu)
        loss   = criterion(logits, labels_gpu)
        optimizer.zero_grad()
        loss.backward()
        optimizer.step()

    # Drain the last prefetched batch
    compute_stream.wait_stream(transfer_stream)
    if prefetched is not None:
        # process last batch
passUsing DataLoader(..., pin_memory=True) causes the DataLoader worker processes to allocate output tensors in page-locked memory automatically. This is the preferred way to ensure all batches are pinned without manual buffer management.
7.2 Pitfall Catalog ⚠️
| Pitfall | Symptom | Fix |
|---|---|---|
Missing record_stream when sharing tensors across streams |
Silent memory corruption; occasionally RuntimeError in allocator |
Call tensor.record_stream(stream) on every stream that will use the tensor after the home stream |
Timing with perf_counter without synchronize |
Reported time is 10–100× smaller than true execution time | Use torch.cuda.Event pair with end.synchronize() |
synchronize() inside training loop |
Throughput collapses to sequential execution; GPU and CPU idle each other | Move synchronize() outside the loop; use event-based barriers for correctness |
| Default stream operation in multi-stream code | All streams serialize at that operation; no overlap in profiler | Wrap every op in torch.cuda.stream(s) context; audit for bare calls |
Unpinned host memory with non_blocking=True |
Copy is silently synchronous; no overlap despite correct stream setup | Ensure all host tensors are pinned (pin_memory=True or torch.pin_memory()) |
elapsed_time before end.synchronize() |
RuntimeError or nonsense result |
Always call end.synchronize() before start.elapsed_time(end) |
| Allocating and freeing on different streams | Pool fragmentation, delayed-free latency, reduced allocator efficiency | Keep tensor lifetime within its home stream where possible |
| Deferred CUDA error reporting | A kernel error appears on a later unrelated CUDA call, making the true source hard to find | Set CUDA_LAUNCH_BLOCKING=1 to force synchronous execution; errors surface immediately at the offending call. Never leave enabled in production — it eliminates all stream parallelism |
References
| Reference Name | Brief Summary | Link to Reference |
|---|---|---|
| CUDA Programming Guide — Asynchronous Execution | Official NVIDIA docs on streams, events, and concurrency primitives | https://docs.nvidia.com/cuda/cuda-programming-guide/02-basics/asynchronous-execution.html |
| CUDA Runtime API — Stream Sync Behavior | Formal semantics of legacy default stream, per-thread default stream, and non-blocking streams | https://docs.nvidia.com/cuda/cuda-runtime-api/stream-sync-behavior.html |
| NVIDIA — Streams and Concurrency Webinar (Rennich) | Classic NVIDIA webinar: copy engines, double buffering, timing with events | https://developer.download.nvidia.com/CUDA/training/StreamsAndConcurrencyWebinar.pdf |
| GPU Pro Tip: CUDA 7 Streams Simplify Concurrency | Practical guide to per-thread default streams and stream creation flags | https://developer.nvidia.com/blog/gpu-pro-tip-cuda-7-streams-simplify-concurrency/ |
| PyTorch — torch.cuda.Stream API | Official PyTorch API reference for Stream | https://docs.pytorch.org/docs/2.12/generated/torch.cuda.Stream_class.html |
| PyTorch — torch.cuda.Event API | Official PyTorch API reference for Event | https://docs.pytorch.org/docs/2.12/generated/torch.cuda.Event.html |
| PyTorch — Tensor.record_stream | API docs and semantics for record_stream |
https://docs.pytorch.org/docs/stable/generated/torch.Tensor.record_stream.html |
| A Guide to PyTorch’s CUDA Caching Allocator (deVito) | Deep-dive into stream-ordered allocation, delayed-free, and the record_stream mechanism |
https://zdevito.github.io/2022/08/04/cuda-caching-allocator.html |
| PyTorch Profiler Tutorial | Official PyTorch tutorial on torch.profiler, record_function, Chrome trace export |
https://docs.pytorch.org/tutorials/recipes/recipes/profiler_recipe.html |
| Roofline Model — GPU Glossary (Modal) | Concise explanation of compute-bound vs memory-bound regimes and ridge point | https://modal.com/gpu-glossary/perf/roofline-model |
| CUDA Default Stream (Lei Mao’s Log Book) | Worked examples of default stream serialization and non-blocking stream semantics | https://leimao.github.io/blog/CUDA-Default-Stream/ |
| PyTorch CUDA Semantics (official notes, 2.12) | Authoritative PyTorch notes on stream semantics, record_stream, backward stream behavior, and the 1.9 sync change |
https://docs.pytorch.org/docs/2.12/notes/cuda.html |
| CUDA Streams — Wentao (wentao.site) | Practical guide to multi-stream patterns, P2P/NVLink multi-GPU, and overlap strategies | https://wentao.site/cuda_streams/ |